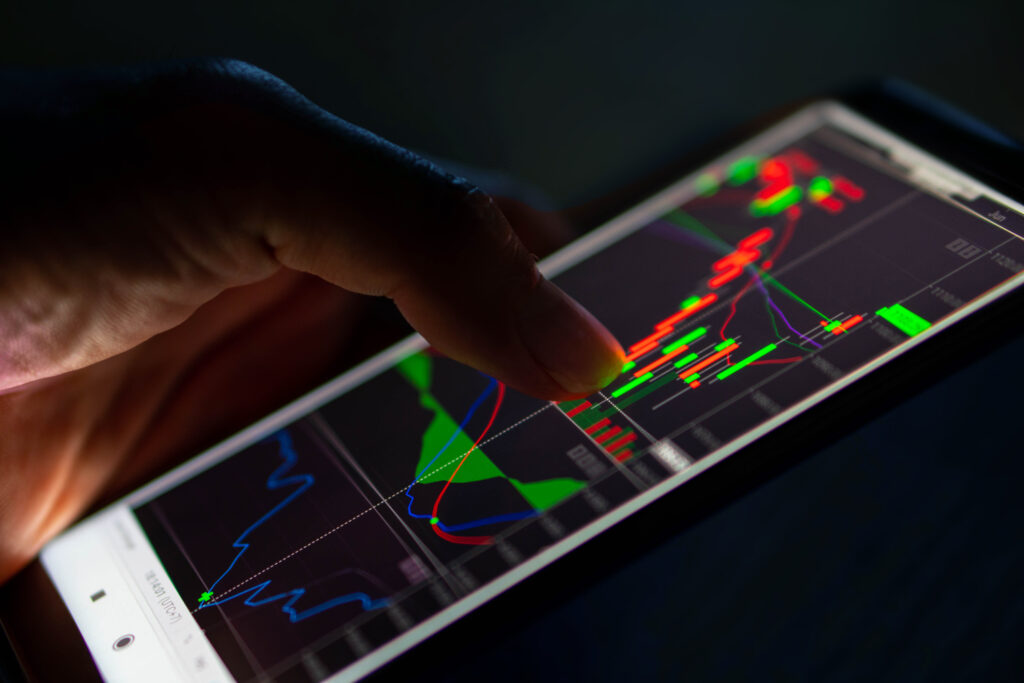
Among the most important skills that a trader can attain is technical analysis. It is the study of the dynamics of past prices and volumes of trade to project future price movements. This analysis can be applied to any market, including stocks, forex, commodities, and cryptocurrencies. Understanding how to use technical analysis will enable traders to make better decisions, find profitable opportunities, and increase their chances of success.
This guide will give an overview of the basics involved in technical analysis, an explanation of some key chart types, and technical indicators you will be using in the strategy of trading.
What is Technical Analysis?
Technical analysis is the study of historical market data, mainly price and volume, in an effort to predict future price action. Unlike fundamental analysis, which focuses on the company’s financials or broader economy, technical analysis is purely price-action-focused.
Traders use charts and indicators in order to analyze price trends and patterns. The underlying philosophy or principle behind technical analysis is that the movement of prices will often repeat because it reflects market psychology, emotions such as fear, greed, and uncertainty.

Key Elements of Technical Analysis:
Price Action:
This is the heart of technical analysis: the movement of a financial instrument’s price over time. A study of price action will reveal trends, reversals, and key support/resistance levels that can help the trader decide on the best course of action.
Volume:
Volume refers to the amount of a security or market that has changed hands over a given period of time. It typically reflects terrific investor interest at high levels and indecision or a lack of interest at low levels. Volume studies confirm events such as trends and price reversals.
Trends:
Trend identification is the very foundation of technical analysis. There are three types of trends:
- Uptrend: Prices are successively reaching higher levels.
- Downtrend: Prices keep on moving lower with each passing day.
- Sideways/Range-bound: Prices move within a horizontal range.
Being able to identify the dominant trend would let traders decide whether to buy, sell, or wait for a better entry opportunity.
Common Types of Charts in Technical Analysis:
In technical analysis, charts are an indispensable tool as they graphically depict price movements over time. Following are some of the most common types:
Line Chart:
A simple chart that plots the series of closing prices over a certain period. It is useful to view the big picture of price movement; however, it lacks detailed information such as opening or closing prices and hence is not very popular among active traders.
Bar Chart:
An extended chart that shows open, high, low, and close prices during any period. Bar charts show a better view of price action and volatility to the traders.
Candlestick Chart:
Similar to bar charts in many ways, but more visually appealing. Each stick represents the open, high, low, and close prices. Candlestick charting is widely used among traders for defining trends and detecting potential reversal signals. Above all, they are particularly very helpful in recognizing patterns such as doji, engulfing, and hammer formations.
Key Technical Indicators:
Technical indicators are mathematical calculations based on the price and volume of a financial instrument. They provide information regarding trends, momentum, volatility, and market strength to the traders. Here are some essential technical indicators:
Moving Averages (MA):
Moving averages smooth out price data over a specific time period. The two most commonly used types are:
Simple Moving Average (SMA): The average of prices over a specified period.
Exponential Moving Average (EMA): This is a weighted moving average that assigns greater importance to more recent prices. Moving averages show the direction of a trend and possible reversal points.
Relative Strength Index (RSI):
The RSI is a momentum oscillator that accounts for the velocity and amplitude of changes within the price of an asset. It fluctuates between 0 and 100, with values greater than 70 considered overbought and values below 30 considered oversold.
Moving Average Convergence Divergence (MACD):
MACD is a category of trend-following momentum indicators that reflect a relationship between two moving averages of the price of an asset. It is thus used in the identification of potential buy and sell signals under conditions of convergence and divergence of these moving averages.
Bollinger Bands:
Bollinger Bands consist of a moving average and two lines of standard deviation above and below it. The bands expand and contract based on market volatility. When prices touch the upper band, the asset may be overbought, and when they touch the lower band, the asset may be oversold.
Volume:
Volume indicators help to confirm a trend’s strength. When price moves with strong volume, there is a high chance of sustainability in that trend. The reverse happens when volume is low in the price move, meaning the trend is too weak or might reverse.

How to Use Technical Analysis in Trading?
Identify the Trend:
First of all, under technical analysis, one must identify the prevailing trend in the market. Moving averages or trendlines can be used to ascertain whether the market is in an uptrend, downtrend, or range-bound.
Confirmation with Indicators:
Once the trend is defined, technical indicators will be used to confirm the strength of a trend. For instance, in case of an uptrend and RSI reading below 70, that would mean the price still has room for upside action.
Set Entry and Exit Points:
Therefore, establish your entry and exit based on the same analysis. Either look for some key levels of support and resistance, or wait for any kind of candlestick pattern or indicator that could trigger the trade. Again, stop-loss orders play a crucial role in managing risk.
Combine with Risk Management:
Technical analysis is no more than a part of any successful trading strategy. Always apply sound risk management practices by setting stop-loss orders, diversification of trades, and only risking a small percentage of your capital on each trade.
Common Mistakes in Technical Analysis to Avoid!
Overcomplicating the Analysis:
Whereas there are lots of indicators and too many tools, the latter only create confusion and paralyze analysis. Stick to a few key indicators that work best for your strategy.
Completely Ignoring Market Conditions:
One should never do technical analysis in complete isolation. Always keep the broader market environment in mind, along with news events that may influence your trades.
Over-relying on Indicators:
Indicators are great, but they aren’t foolproof. They always need to be used with price action analysis and other tools to make better decisions.
Conclusion:
Technical analysis is a powerful tool for traders in the aim of predicting market movements or making better trading decisions. By understanding charts, indicators, and how to put them into practice, traders can develop strategies that create a higher likelihood of success. However, it is technical analysis coupled with sound risk management that will protect your capital and ensure long-term profitability.
Start small, be disciplined, and practice consistently toward becoming proficient in technical analysis and trading.
Experience seamless execution and real-time data on FinProfm.
Table Of Content
Recent Posts
- Top 10 Commodities

- Top 5 Forex Trading Strategies for Consistent Profits in 2025 (All You Need to Know)

- Day Trading vs. Position Trading in Commodities: Which Strategy Works?

- Best Crypto Trading Strategy in 2025: Learn How to Trade Cryptocurrency in 5 Easy Steps!

- The Role of Technical Indicators in Trading: Enhancing Your Analysis


