In the fast-paced world of trading, having the right tools and techniques can make all the difference. One of the most effective ways to assess potential market movements and make informed decisions is through technical analysis. By analyzing historical price data, chart patterns, and various technical indicators, traders can gain valuable insights into market trends and price movements.
Whether you are a beginner looking to understand the basics or an experienced trader refining your strategies, technical analysis is a powerful tool in your trading arsenal. In this article, we will explore the importance of technical analysis, the key elements of chart reading, and some popular tools that can help you analyze the markets like a pro.
What is Technical Analysis?
Technical analysis is the study of past market data—primarily price and volume—to make predictions about future price movements. It is based on the idea that all market information is reflected in its price, and that price movements tend to follow trends. Traders use technical analysis to forecast which direction prices will move and to identify the best times to initiate and liquidate a trade.
Unlike fundamental analysis, which focuses on the intrinsic value of an asset—such as earnings, growth, or economic factors—technical analysis is purely concerned with price action. For this reason, technical analysis is applicable to all asset classes, including stocks, forex, commodities, and cryptocurrencies.

Why is Technical Analysis Important?
Here are several reasons why technical analysis is essential for traders:
- Helps to Identify Trends: Technical analysis excels at pinpointing a market trend and following it. Whether it’s a stock or forex, identifying whether the market is in an uptrend or downtrend helps in making wiser decisions about when to buy or sell.
- Objective Decision-Making: It removes emotions from trading because decisions are based on data analysis rather than gut instincts. Objective indicators guide traders in the right direction.
- Applicable to Any Market: Whether you trade in forex, stocks, crypto, or commodities, technical analysis is versatile and works well for all markets.
- Better Entry and Exit: By using key support and resistance levels, chart patterns, and price trends, traders can better time their entries and exits.
What to Know About Technical Analysis:
To become proficient in technical analysis, you need to understand the following concepts:
1. Price Charts
Price charts are the most basic tool in technical analysis, displaying the historical movements in the price of an asset over a given period. The most commonly used charts are:
- Line Charts: Simple and effective, line charts show the closing price of an asset over a specified period, connected by a line.
- Bar Charts: These charts record the open, high, low, and close prices (OHLC) over a given time period.
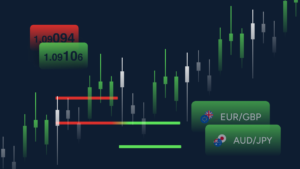
- Candlestick Charts: A more advanced version of bar charts, candlestick charts display OHLC data with color coding, indicating whether the price movement was bullish or bearish.
2. Trends
A trend represents the general direction the market is moving in. There are three main types of trends:
- Uptrend: The price consistently moves upwards.
- Downtrend: The price consistently moves downwards.
- Sideways Trend (Range-bound): Price movement remains within a narrow range, reflecting market indecision.
Successful technical analysis relies on correctly identifying the trend and trading accordingly.
3. Support and Resistance
Support and resistance are fundamental concepts in technical analysis:
- Support: The price level at which demand is strong enough to prevent further decline in price.
- Resistance: The price level at which selling pressure is strong enough to prevent further price increase.
Traders use support and resistance levels to decide when to enter or exit trades. These levels often act as psychological barriers, influencing traders’ reactions to price movements.

Popular Tools and Indicators of Technical Analysis:
There are several tools and indicators that traders use to analyze the market and make decisions. Here are some of the most widely used:
1. Moving Averages
A moving average smooths out price data to create a trend-following indicator. It helps traders quickly assess the market’s direction and identify potential reversals.
- Simple Moving Average (SMA): The average of the closing prices over a fixed period.
- Exponential Moving Average (EMA): A weighted moving average that gives more weight to recent prices, making it more sensitive to current market conditions.
2. Relative Strength Index (RSI)
RSI is a momentum oscillator that measures the speed and change of price movements. It helps traders identify overbought or oversold conditions.
- RSI Range: RSI ranges from 0 to 100. When it is above 70, the market is considered overbought, potentially signaling a sell. When it is below 30, the market is considered oversold, suggesting a possible buy.
3. Moving Average Convergence Divergence (MACD)
MACD is a trend-following momentum indicator that shows the relationship between two moving averages: the 12-day EMA and the 26-day EMA. A MACD crossover above the signal line may indicate a potential buy, while crossing below the signal line might suggest a sell.
4. Bollinger Bands
Bollinger Bands consist of a moving average and two standard deviation lines. When volatility is high, the bands expand, and when volatility is low, they contract. Traders often watch for price action near the outer bands as an indication of overbought or oversold conditions.
Chart Patterns Every Trader Should Know:
Chart patterns are another key component of technical analysis, helping traders predict future price movements based on historical trends. Some of the most common chart patterns include:
- Head and Shoulders: A reversal pattern that indicates a change in trend direction. It can be bullish (inverse head and shoulders) or bearish.
- Double Top and Double Bottom: These patterns indicate potential reversals after a prevailing trend.
- Triangles: Ascending, descending, and symmetrical triangles indicate periods of consolidation before a breakout in either direction.
- Flags and Pennants: Continuation patterns that suggest the prevailing trend will resume after a brief consolidation.
Conclusion:
Mastering technical analysis is essential for any trader. By learning to read price charts, identify trends, understand key market indicators, and recognize common chart patterns, traders can make more informed decisions, thereby increasing their chances of success. Whether you are trading stocks, forex, crypto, or commodities, technical analysis gives you the tools needed to navigate the markets like a pro.
Start with the basics, and gradually incorporate more advanced tools and techniques into your trading strategy. With time, practice, and experience, you will gain the confidence to make smarter, data-driven decisions and enhance your trading performance.
Take the first step towards trading success with FinProfm.
Table Of Content
Recent Posts
- Top 10 Commodities

- Top 5 Forex Trading Strategies for Consistent Profits in 2025 (All You Need to Know)

- Day Trading vs. Position Trading in Commodities: Which Strategy Works?

- Best Crypto Trading Strategy in 2025: Learn How to Trade Cryptocurrency in 5 Easy Steps!

- The Role of Technical Indicators in Trading: Enhancing Your Analysis


