Technical indicators are essential tools for traders, providing crucial insights into price movements, market trends, and potential entry and exit points. Derived from price and volume data, these indicators help traders make informed decisions, minimize emotional biases, and identify profitable opportunities.
With numerous indicators available, it can be overwhelming for beginners to determine which ones to use and how to incorporate them into a trading strategy. This article delves into the basics of technical indicators, their functions, and how to effectively apply them to enhance your trading analysis.
What Are Technical Indicators?
Technical indicators are mathematical calculations based on historical price and volume data. These indicators help traders spot patterns, trends, and possible reversal points, providing a clearer understanding of an asset’s price movement. Technical indicators fall into several categories, each serving different purposes in the market, such as identifying trends, measuring momentum, assessing volatility, or analyzing volume.
Categories of Technical Indicators:
- Trend-following indicators: Help identify and confirm the direction of the market trend.
- Momentum indicators: Measure the strength of a trend and potential reversal points.
- Volatility indicators: Measure the market’s price fluctuations.
- Volume indicators: Assess the strength of price moves based on trading volume.
How Technical Indicators Work
Most technical indicators rely on a combination of price action (open, high, low, close) and trading volume data. By analyzing these variables, indicators provide values that help traders interpret market conditions. For instance, Moving Averages smooth out price fluctuations over a defined period, helping traders spot the overall trend direction. Similarly, indicators like the RSI measure market momentum and can highlight when an asset is overbought or oversold.
By combining multiple indicators, traders can gain a more comprehensive understanding of the market, increasing their ability to make informed decisions.
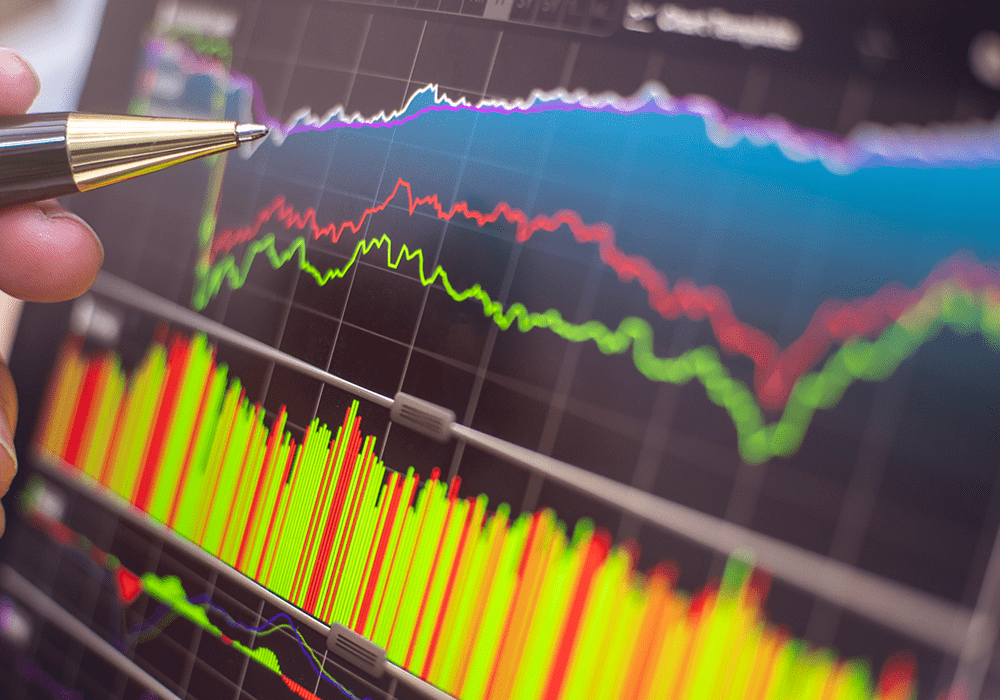
Types of Technical Indicators and How to Use Them:
1. Trend-Following Indicators
Trend-following indicators help traders confirm the direction of a market trend. These indicators are most effective in trending markets where the price is moving steadily in one direction.
- Moving Averages (MA): The most commonly used trend-following indicator. It calculates the average closing price over a specific period, smoothing out price fluctuations. The Exponential Moving Average (EMA), which gives more weight to recent prices, is more responsive to price changes than the Simple Moving Average (SMA). A popular strategy involves buying when the price crosses above the moving average and selling when it crosses below. The Golden Cross (short-term moving average crossing above the long-term moving average) is a bullish signal, while the Death Cross (short-term moving average crossing below the long-term moving average) is bearish.
- Average Directional Index (ADX): This measures the strength of a trend, not its direction. Readings above 25 indicate a strong trend, while below 20 suggests a weak or non-existent trend. ADX is often used with other indicators to confirm the strength of the trend.
2. Momentum Indicators
Momentum indicators gauge the strength of a price movement and the likelihood of a reversal.
- Relative Strength Index (RSI): A momentum oscillator ranging from 0 to 100 that indicates overbought or oversold conditions. An asset is considered overbought when RSI is above 70 and oversold when below 30. Traders look for reversals when the RSI reaches these levels.
- Moving Average Convergence Divergence (MACD): An all-around momentum indicator showing the relationship between two EMAs (12-day and 26-day). A bullish crossover (short-term EMA crossing above the long-term EMA) signals a buy, while a bearish crossover (short-term EMA crossing below the long-term EMA) signals a sell.
3. Volatility Indicators
Volatility indicators measure how much an asset’s price fluctuates and can help traders determine when to be cautious or when a market is likely to break out.
- Bollinger Bands: Consist of three lines: a middle moving average, an upper band, and a lower band. The bands expand and contract based on market volatility. When the price approaches the upper band, the asset may be overbought; when it nears the lower band, it may be oversold. Bollinger Bands help traders identify periods of high or low volatility.
- Average True Range (ATR): Measures the volatility of an asset by calculating the average range between its high and low prices over a set period. Higher ATR values indicate greater volatility, while lower values signal lower volatility. Traders can adjust their position sizes based on the ATR to manage risk.
4. Volume Indicators
Volume indicators assess the strength of price movements by analyzing the amount of trading activity.
- On-Balance Volume (OBV): A cumulative volume indicator that shows whether volume is increasing or decreasing alongside price movements. If the price is rising and OBV increases, it confirms that the upward trend is supported by strong buying activity.
- Accumulation/Distribution Line (A/D Line): Combines price and volume to show whether an asset is being accumulated (bought) or distributed (sold). An upward-trending A/D Line suggests accumulation, while a downward trend suggests distribution.
How to Use Technical Indicators Effectively:
Combine Indicators for Confirmation
No single indicator should be used in isolation. Successful traders often combine several indicators to confirm signals. For example, a trader might use a moving average to identify the trend direction, then check the RSI to see if the market is overbought or oversold before entering a trade. Using multiple indicators enhances decision-making and provides greater confidence in the trade signals.
Don’t Overload with Indicators
While technical indicators are valuable tools, using too many can lead to “analysis paralysis.” Traders may become overwhelmed with conflicting signals and struggle to make decisions. It’s important to focus on a few key indicators that complement each other and align with your trading strategy.
Limitations of Indicators
Indicators are not infallible. They may give false signals, especially in choppy or sideways markets. They should be used in conjunction with other forms of analysis, such as fundamental analysis or market sentiment. Indicators also need to be adjusted as market conditions change.
Backtest Your Strategy
Before using technical indicators in live trading, backtest your strategy using historical market data. This allows you to assess the effectiveness of your indicators and trading strategy under different market conditions. Backtesting builds confidence and helps identify the strengths and weaknesses of your approach.
Conclusion:
Technical indicators are powerful tools that help traders make more informed decisions, identify trends, and enhance analysis accuracy. By using indicators such as trend-following, momentum, volatility, and volume indicators, traders can improve their ability to predict price movements and manage risk.
However, it’s essential to understand the limitations of indicators and combine them effectively with other analysis techniques. By focusing on key indicators and adjusting strategies to market conditions, traders can increase their chances of success in the markets.
Table Of Content
Recent Posts
- Top 10 Commodities

- Top 5 Forex Trading Strategies for Consistent Profits in 2025 (All You Need to Know)
- Day Trading vs. Position Trading in Commodities: Which Strategy Works?
- Best Crypto Trading Strategy in 2025: Learn How to Trade Cryptocurrency in 5 Easy Steps!

- The Role of Technical Indicators in Trading: Enhancing Your Analysis
